

Summary #
This article walks through composing and running a model in MP Ember and inspecting the traces it produces. MP Ember is built on the U.S. Navy–developed Monterey Phoenix (MP) behavior-modeling framework, which generates every possible event trace allowed by your rules — including combinations you might not anticipate.
This article uses a small, cyber-relevant example throughout.
The Example #
Consider two independent but interacting actors:
- An Employee either requests sensitive data or does not request it.
- A System either grants access or denies it.
By hand, that’s four possible outcomes:
- Request + Grant — expected authorized access
- Do not request + Deny — expected policy enforcement
- Request + Deny — a blocked attempt
- Do not request + Grant — an unwanted combination
MP Ember generates all four automatically, so emergent or unwanted combinations (like #4) surface on their own.
Step 1 — Open a Place to Work #
Decide where to write the model:
- Project mode — for work you want to keep. Open a project (or create one) so your code is saved automatically as you type.
- Scratch Pad mode — for quick experiments that aren’t saved.
Use the mode toggle in the top-left to switch. For this walkthrough, either mode works.
Step 2 — Enter the schema #
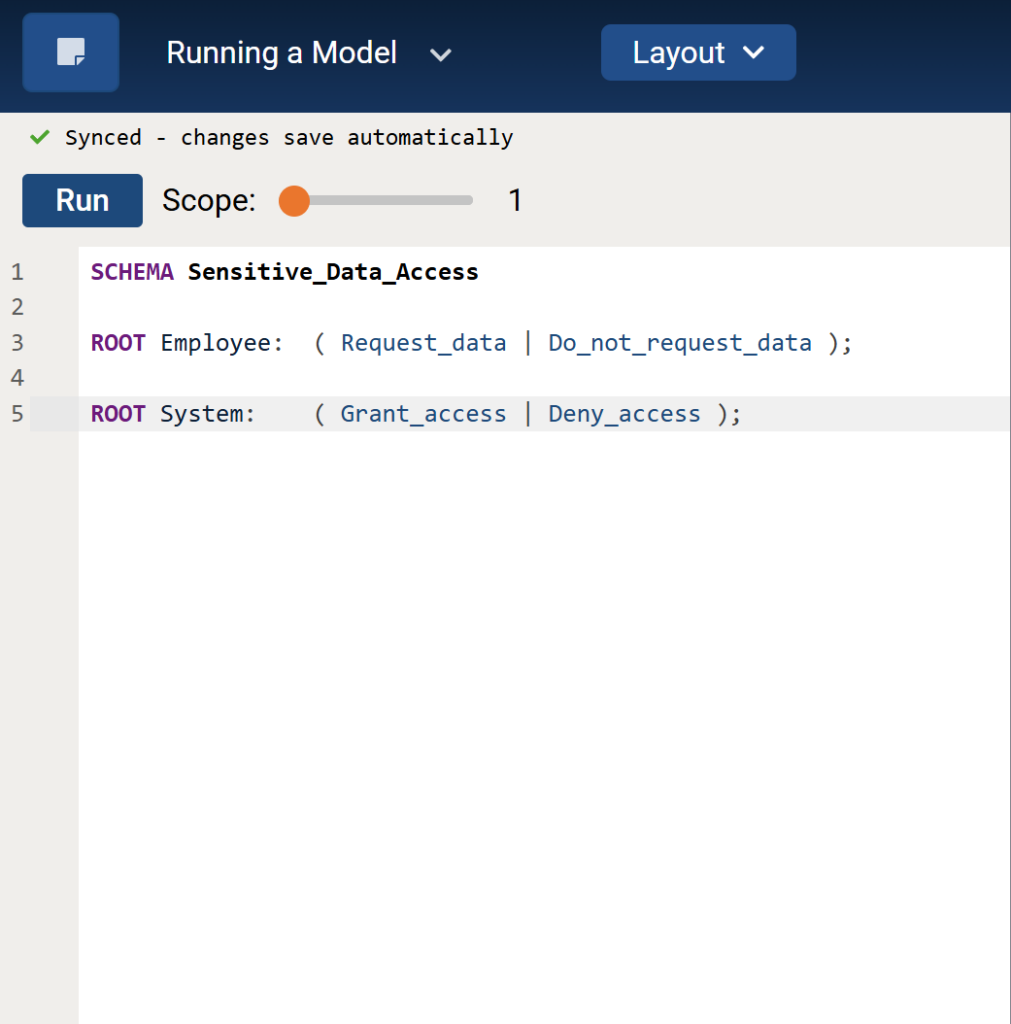
Type your model into the code editor. Here is the example expressed as a simple MP schema with two root events, each offering two alternatives:
SCHEMA Sensitive_Data_Access

ROOT Employee: ( Request_data | Do_not_request_data );

ROOT System:   ( Grant_access | Deny_access );
SCHEMA Sensitive_Data_Access

ROOT Employee:  ( Request_data | Do_not_request_data );

ROOT System:    ( Grant_access | Deny_access );
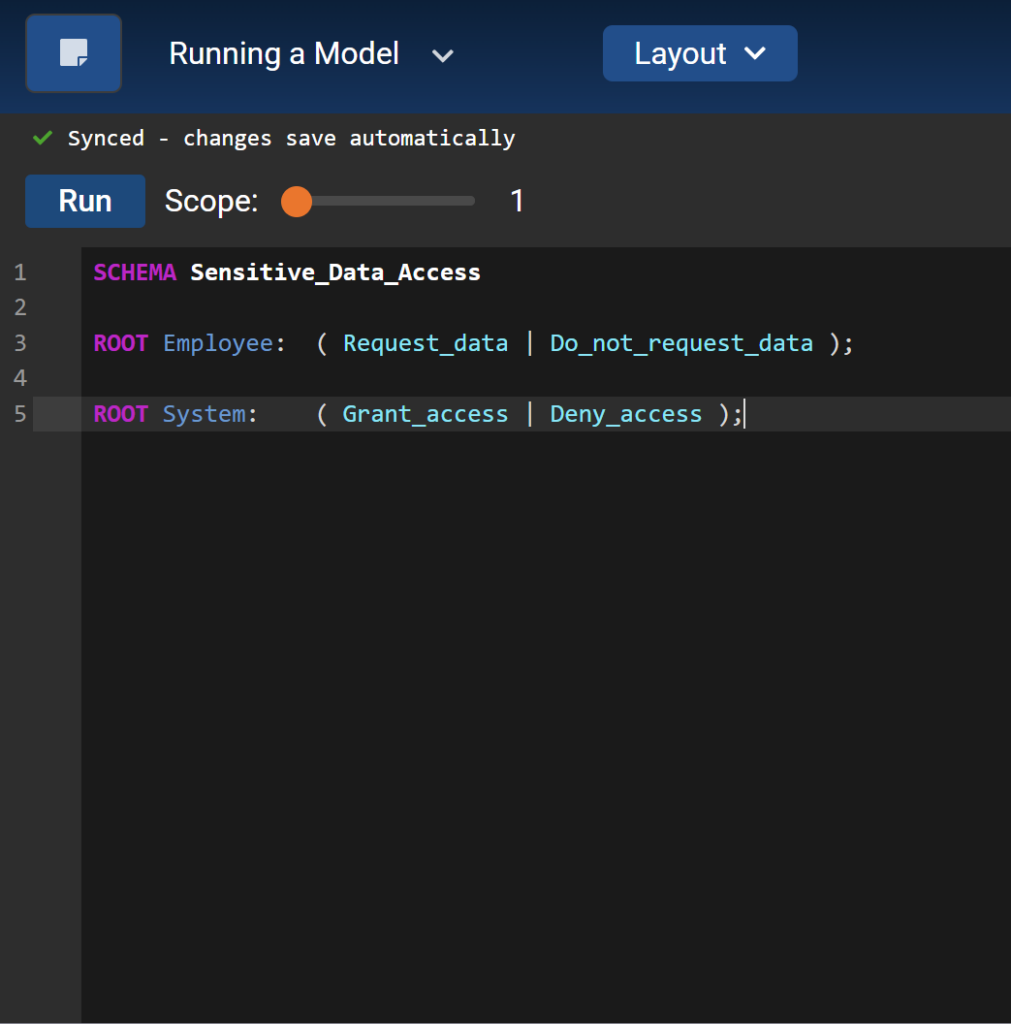
- SCHEMA names the model.
- Each ROOT is an independent actor.
- The vertical bar | means “either / or” — MP will explore every alternative.
Two roots with two alternatives each yield 2 × 2 = 4 combinations — the four outcomes above.
As you type, the editor checks your code. If there’s a problem, the status bar above the editor shows the number of errors; hover the info icon to see details.
Step 3 — Set the Scope #
Use the Scope slider (1–5) beside the Run button.
- Scope limits how many times a repeatable behavior can occur, which in turn bounds how many traces are generated.
- For this example, scope 1 is enough to produce the four traces.
- Higher scopes are intended for models with iterative events (loops) to explore more behavior combinations. For models with many branches or nested loops, runs at higher scopes take more time.
Step 4 — Run the Model #
Click Run.
While the model runs:
- The button shows Running…, and a Cancel button appears if you need to stop.
- The logs pane (below the editor) shows execution progress between Start of execution and End of execution markers.
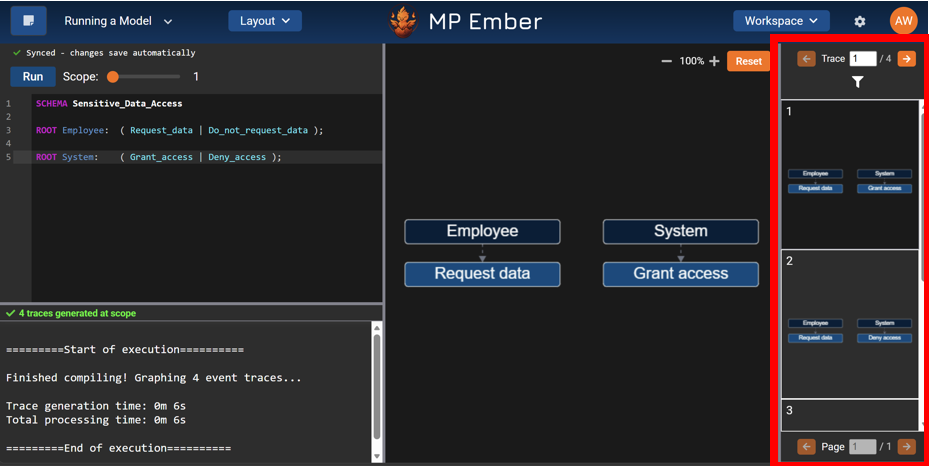
When it finishes, the status bar reports success, for example: “4 traces generated at scope 1.” If compilation fails, it shows “Error compiling, check below for details” — check the logs pane for the message.
Step 5 — Inspect the Traces #
Generated traces appear in the trace navigation pane on the right.
- Click a trace to view it in the center graph.
- Use the Up / Down arrow keys to move between traces, and Left / Right to page through them (if there are many).
Generated traces appear in the trace navigation pane on the right.
- Click a trace to view it in the center graph.
- Use the Up / Down arrow keys to move between traces, and Left / Right to page through them (if there are many).
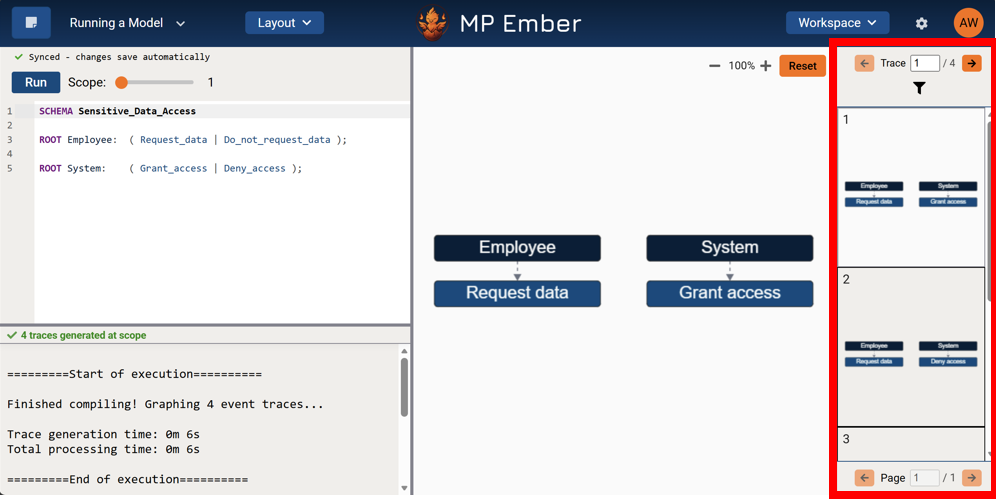
For the small example provided, you’ll find four traces corresponding to the four outcomes — including Do not request + Grant, an unwanted combination that manual analysis can miss, especially in systems with more complex behavior logic.
Step 6 — Read Each Graph #
Each trace is drawn as a directed graph. Use the Graph Legend (in Help) as a reference:
- Event boxes are color-coded by type — root, composite, and atomic events.
- Arrows show relationships between events: a precedes (sequential) relationship (solid arrow) and an encloses (containment) relationship (dashed arrow).
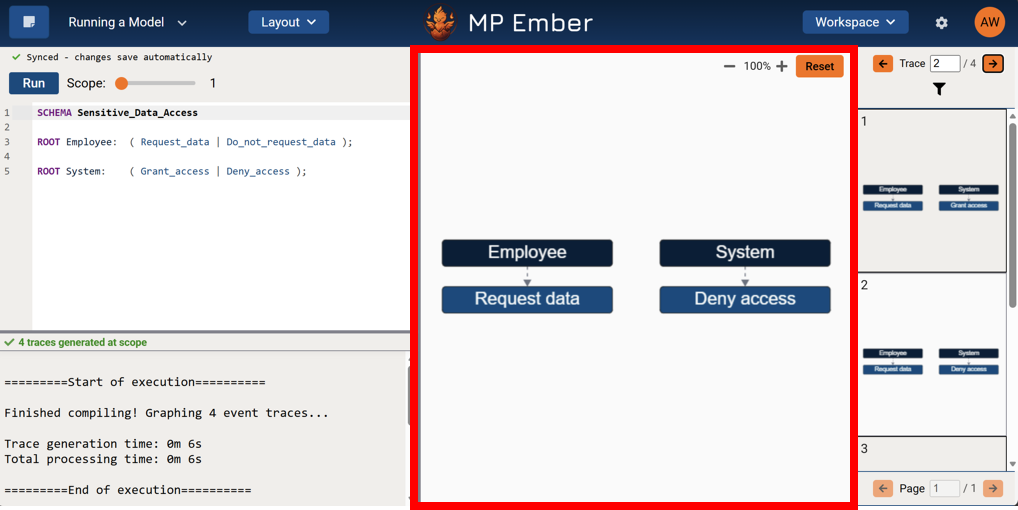
Each trace is drawn as a directed graph. Use the Graph Legend (in Help) as a reference:
- Event boxes are color-coded by type — root, composite, and atomic events.
- Arrows show relationships between events: a precedes (sequential) relationship (solid arrow) and an encloses (containment) relationship (dashed arrow).
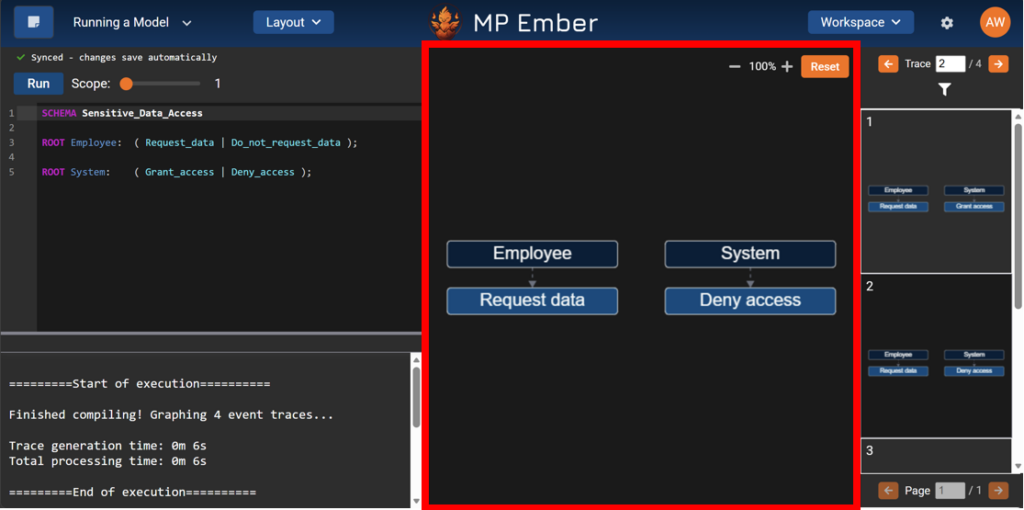
In the example, each trace shows the Employee and System root events, each containing the atomic event that occurred in that trace (for instance, Employee requests data and System denies access).
Tip: You can rearrange nodes to read a trace more easily. Manual positions affect only your current view.
Step 7 — Analyze and Export #
- Sort traces: Use the sort options at the top of the trace pane to prioritize by Marked, # of Events, and Probability (if shown). (Our simple example does not make use of this feature.)
- AI Trace Analyzer: If enabled (Settings → Traces), open the analyzer below the center view to generate and analyze a trace description and plausible stories for your most interesting traces.
- Export: From the Project or Scratch Pad menu, choose Export to save the model (.mp or .wng) or the selected trace as a PNG. The AI Trace Analyzer Report tab (if enabled) provides an export capability to save your trace analysis work.
What to Take Away #
Writing a few simple rules can produce more behaviors than expected. Running the model in MP Ember enumerates them all, making it easier to spot expected, unexpected, positive, neutral, and negative outcomes permitted by your rules — the foundation of emergent-behavior analysis.
